BDS 761: Data Science and Machine Learning I

Basically, boil multiple numbers (vectors, matrices, time series,...) or entire functions down to a single number
Examples
Always can be critized as discarding important info, but need to use something
"Length" of a vector (as opposed to length of the data structure, i.e. number of dimensions)
Also known as $\|x\|_2$, the "two-norm"
Also use a built-in function to do this
Exercise: give Euclidean norm using dot products
Exercise: give Euclidean norm of sum of vectors $x+y$ in terms of dot products
(use result of previous exercise and work only with vectors)
$$||x+y||_2 = ???$$$$ \sqrt{(x_1+y_1)(x_1+y_1) + (x_2+y_2)(x_2+y_2) + ... } = $$Consider the list of data for different "dimensions", for one person, product, etc.
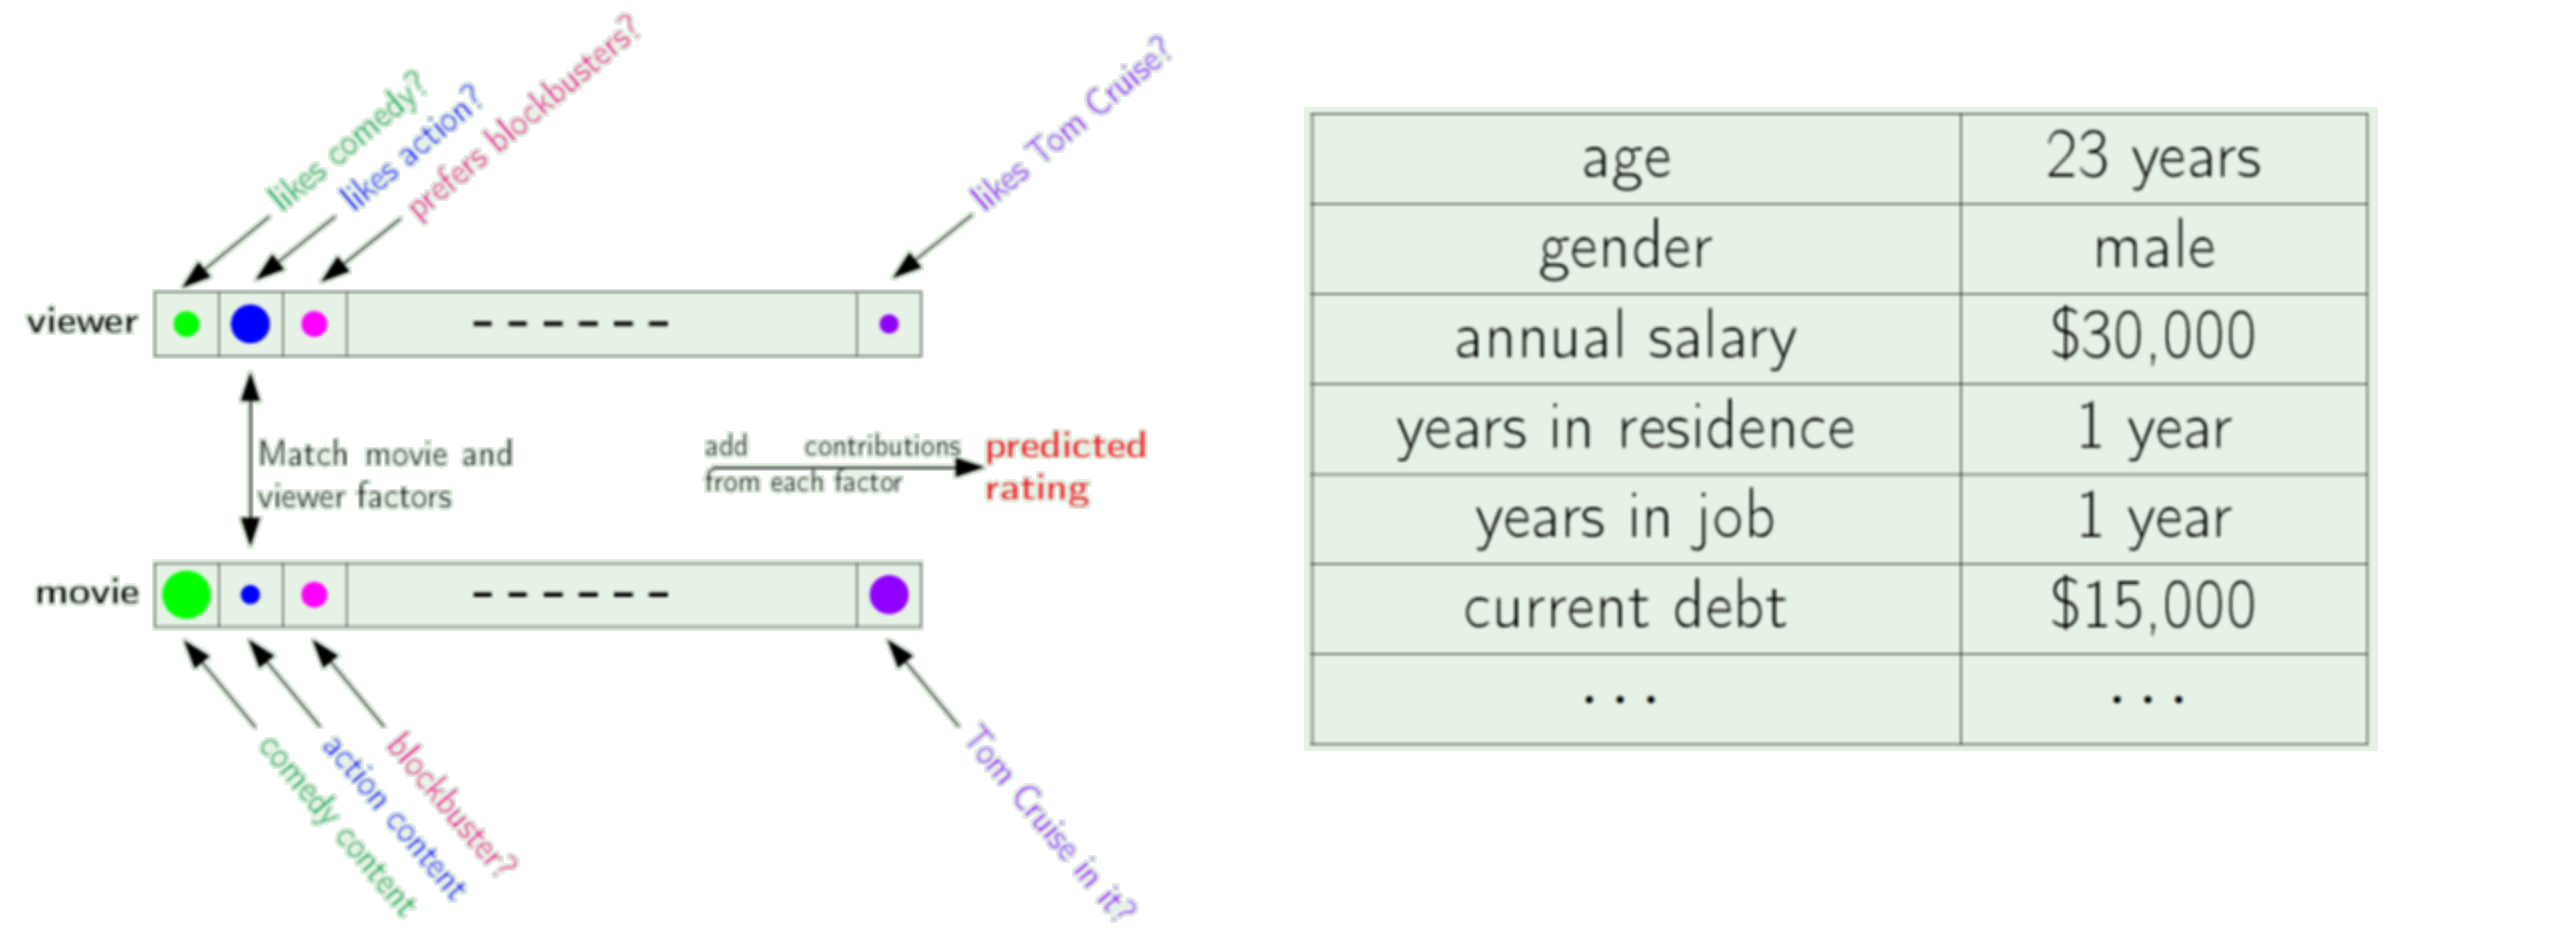
Does it make sense to compute Euclidean distance to tell us how "big" the vector is?
A norm is a vector "length". Often denoted generally as $\Vert \mathbf x \Vert$.
Properties
For any $n$-dimensional real or complex vector. i.e. $x \in \mathbb{R}^n \text{ or } \mathbb{C}^n$
$$ \|x\|_p = \left(|x_1|^p+|x_2|^p+\dotsb+|x_n|^p\right)^{\frac{1}{p}} $$$$ \|x\|_p = \begin{pmatrix}\sum_{i=1}^n{|x_i|^p} \end{pmatrix}^{\frac{1}{p}} $$Consider the norms we have looked at. What is $p$?
Note we often lazily write these as e.g. "L2" norm due to formatting limitations
Exercise: Plug in $p$ and simplify the equation for each $p$-norms for a vector $x$ for $p$ = 1,2,0,$\infty$... $ \|x\|_p = \begin{pmatrix}\sum_{i=1}^n{|x_i|^p} \end{pmatrix}^{\frac{1}{p}} $
Exercise: test the conditions for the $\ell_\infty$ norm
Exercise: test the conditions for the so-called $\ell_0$ norm
import numpy as np

v = [1,3,1,4]

for p in range(1,10):
    print(p,np.power(sum(np.power(np.abs(np.array(v)),p)),1/p))
1 9.0
2 5.196152422706632
3 4.530654896083492
4 4.290915128445443
5 4.175344598847825
6 4.110988070009078
7 4.0723049678331895
8 4.048006070825583
9 4.032310478684122
What are the $\ell_1$ , $\ell_\infty$, and "$\ell_0$" norms of $\vec{a} = \begin{bmatrix}1\\3\\1\\-4\end{bmatrix}$ and $\vec{b} = \begin{bmatrix}2\\0\\1\\-2\end{bmatrix}$?
The Set $\{x | \Vert x \Vert_p \le 1 \}$, $ \|x\|_p = \begin{pmatrix}\sum_{i=1}^n{|x_i|^p} \end{pmatrix}^{\frac{1}{p}} $
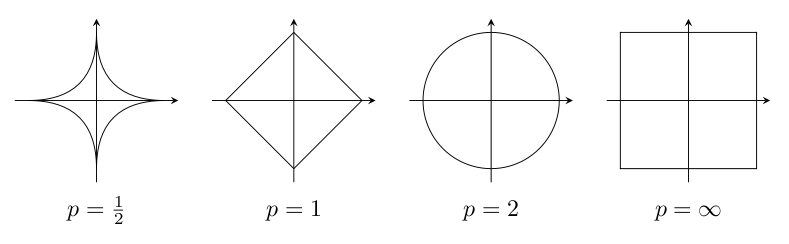
All vectors of length $\le 1$
Note how $\Vert x \Vert_a \le \Vert x \Vert_b$ if $a\ge b$
Inner product = length squared
$$v \cdot v = v^T v = \| v \|_2^2 = \| v \|_2\| v \|_2$$Angle $\theta$ between two vectors
$$v \cdot w = v^T w = \| v \|_2\| w \|_2 \cos\theta$$Derive by noting that $\| v + w \|^2 = \|v\|^2 + v^Tw + \|w\|^2$ then use Cauchy-Schwartz and complete square
For any symmetric positive definite matrix $S$
$$\| v \|_S^2 = v^T S v$$Proposed by Lorentz for 4-dimensional spacetime, $v = (x,y,z,t)^T$, $c$ is speed of light
$$\| v\|^2_M = x^2+y^2+z^2-ct^2$$Is it a true norm?
Again this may not make sense for various vectors. And again we have many alternatives.
What is the relationship?
A distance metic $d(\mathbf x,\mathbf y)$ must satisfy four particular conditions to be considered a metric:
Write the Euclidean distance between two points entirely in terms of dot products.
What does this tell you about using dot products to compare vector similarity?
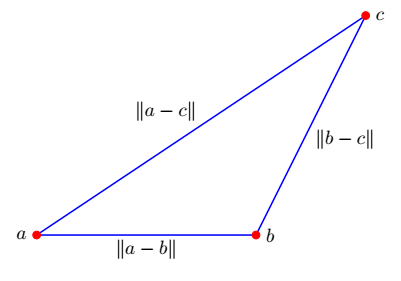
$\Vert \mathbf x + \mathbf z\Vert \leq \Vert \mathbf x\Vert + \Vert \mathbf z\Vert$
$d(\mathbf a,\mathbf c) \leq d(\mathbf a,\mathbf b) + d(\mathbf b,\mathbf c)$
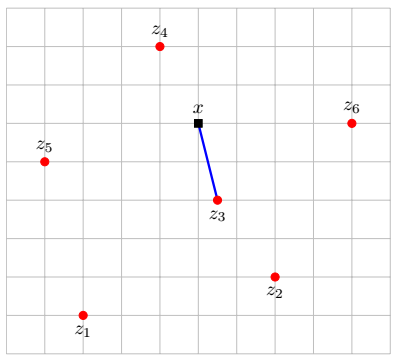
Recommender syatem based on most similar customers to movie properties
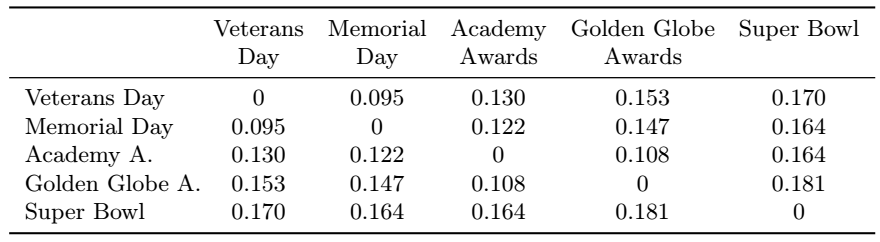
Question: what are the units of the distance here?
Time series prediction (stocks or temperature) compared to truth in retrospect
Measures the relationships between points at right angles, meaning that we sum the absolute value of the difference in vector coordinates.
This metric is sensitive to rotation.
$$d_{M}(a,b) = \sum_{i=1}^{n}|b_i-a_i|$$Does it fulfill the 4 conditions?
The Chebyschev distance or sometimes the $L^{\infty}$ metric, between two vectors is simply the the greatest of their differences along any coordinate dimension:
$$d_{\infty}(\mathbf a,\mathbf b) = \max_{i}{|(b_i-a_i)|}$$...consider
High school geometry: $\mathbf a \cdot \mathbf b = \|\mathbf a\|_2\|\mathbf b\|_2 \cos\theta$
Only depends on angle between the vectors
$$d_{\cos}(\mathbf a,\mathbf b) = 1-\frac{\mathbf a \cdot \mathbf b}{\|\mathbf a\|\|\mathbf b\|} = 1 - \cos\theta$$...consider (extra carefully)
Implement the metrics manually and compute distances between:
$ \begin{bmatrix} 1 \\ 2 \\ 3 \\ 4 \end{bmatrix}$ and $ \begin{bmatrix} 5 \\ 6 \\ 7 \\ 8 \end{bmatrix}$
Given pretty a learning algorithm based on minimizing distances, can apply it to anything with an appropriate distance definition, possibly even if the distances aren't completely "compliant" with the definition.
E.g. zero-norm and cosine similarity can be used in some algorithms, though not others which may depend on some axiomatic property like the triangle inequality.
The hamming distance can be used to compare nearly anything to anything else.
Defined as the number of differences in characters between two strings of equal length, ie:
$$d_{hamming}('bear', 'beat') = 1$$$$d_{hamming}('cat', 'cog') = 2$$$$d_{hamming}('01101010', '01011011') = 3$$Similar to hamming distance, but also includes insertions and deletions, and so can compare strings of any length to each other.
$$d_{edit}('lead', 'gold') = 4$$$$d_{edit}('monkey', 'monk') = 2$$$$d_{edit}('lucas', 'mallori') = 8$$For comparing distributions. Very important in Machine Learning (basis for training classifiers).
Not a true distance (obviously not symmetric).
$$ D_{KL}(P \parallel Q) = \sum_i P(X=x_i) \log \frac{P(X=x_i)}{Q(X=x_i)} $$
$$ = \sum_i P(X=x_i) \left[ \log P(X=x_i) - \log {Q(X=x_i)} \right] $$
Consider the relation between norms and simple statistical quantities
\begin{align} \text{Population mean} &= \mu = \frac{\sum_{i=1}^N x_i}{N} \\ \text{Sample mean} &= \bar{x} = \frac{\sum_{i=1}^n x_i}{n} \\ \text{Population variance} &= \sigma^2 = \frac{\sum_{i=1}^N (x_i - \mu)^2}{N} \\ \text{Sample variance} &= s^2 = \frac{\sum_{i=1}^n (x_i - \bar{x})^2}{n - 1} = \frac{\sum_{i=1}^n x_i^2 - \frac{1}{n}(\sum_{i=1}^n x_i)^2}{n - 1} \\ \text{Standard deviation} &= \sqrt{\text{Variance}} \end{align}Look kind of familiar? Relate to variance.
Assume you have a vector containing samples. Write the following in terms of norms and dot products:
So what does this tell you about comparing things using distances versus dot products versus statistics?
We can now perform a variety of methods for preprocessing data.
Suppose we put our data (such as the Iris data) into vectors, one for each flower measurement ("feature").
We could:
What is the mean and variance now?
"Standard" comes from standard normal distribution.
Standardize the columns of the Iris dataset using linear algebra.
Test it worked by computing the mean and norm of each column.
Load and investigate the IRIS dataset from scikit.
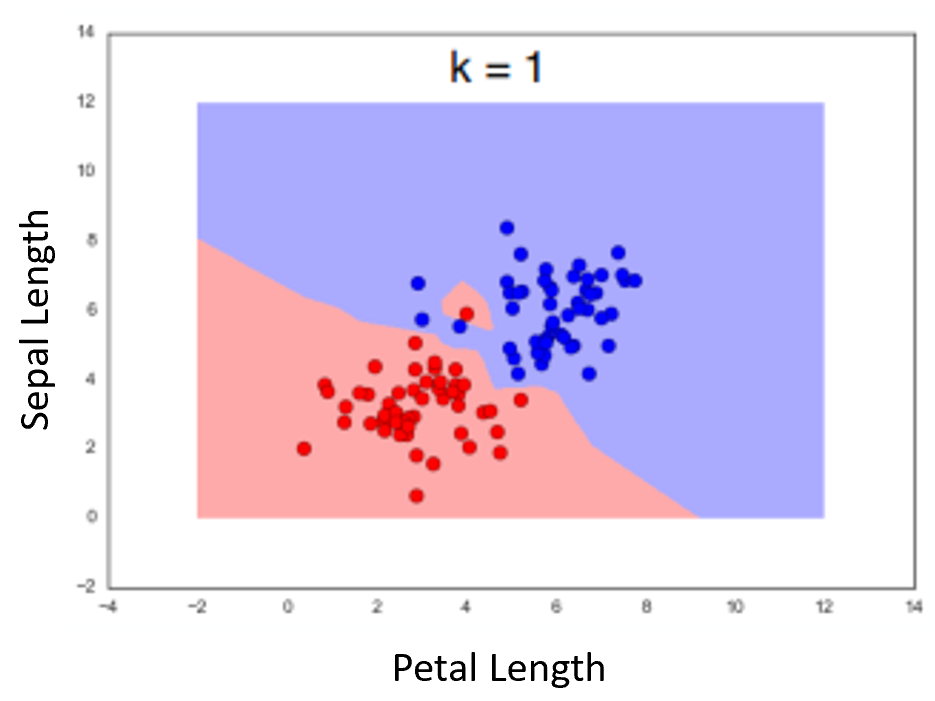
Imagine we flower measurements for one of the flowers but don't know the flower type. We want to classify its type by finding the flower of known type which is most similar.
Do this by taking each flower and computing a distance metric between its measurements and that of every other flower. Take the type of the "nearest" flower as your estimate of the flower type.
Compute the accuracy of this technique based on how many flowers are classified correctly in this way.
Try using different distance metrics to compare flowers. Which makes most sense?
see also: https://scikit-learn.org/stable/modules/generated/sklearn.neighbors.KNeighborsClassifier.html
from sklearn import datasets
iris = datasets.load_iris()

dir(iris)
['DESCR',
 'data',
 'data_module',
 'feature_names',
 'filename',
 'frame',
 'target',
 'target_names']
(iris.data[:10], iris.target[:10])
(array([[5.1, 3.5, 1.4, 0.2],
        [4.9, 3. , 1.4, 0.2],
        [4.7, 3.2, 1.3, 0.2],
        [4.6, 3.1, 1.5, 0.2],
        [5. , 3.6, 1.4, 0.2],
        [5.4, 3.9, 1.7, 0.4],
        [4.6, 3.4, 1.4, 0.3],
        [5. , 3.4, 1.5, 0.2],
        [4.4, 2.9, 1.4, 0.2],
        [4.9, 3.1, 1.5, 0.1]]),
 array([0, 0, 0, 0, 0, 0, 0, 0, 0, 0]))
iris.data[52]
array([6.9, 3.1, 4.9, 1.5])
Example using two features. Dots represent the measurements for the flowers in the dataset. Color of background is class of nearest neighbor (as if the point was the measurements for an unknown flower we were classifying)