Machine Learning
Keith Dillon
Fall 2018
Topic 1: Introduction and the Perceptron
Course Information
- Labs/Participation - 15%
- Homework - 15%
- Midterm - 20%
- Final Exam - 25%
- Project - 25%
Point of exams is basically to make sure you didn't cheat on labs and homeworks.
Will discuss project later. Basically it will be a more complete version of a lab project, including validation and writeup. And a poster session defending your analysis.
Topics (preliminary list)
- Introduction
- Python Tools
- Basic Linear Algebra Concepts & Jargon
- Linear Algebra & Dimensionality Reduction
- k Nearest Neighbor Classification
- Clustering
- Statistics
- Probability
- Regression
- Optimization
- Ensembles
- Bias, Variance, & Performance Metrics
- Support Vector Machines and Kernels
- Neural Networks
Note that some topics are shorter or longer than a single course meeting, so the topic numbers do not directly map to class number.
Content Breakdown
I. Fundamentals
- Linear algebra
- Prob & Stat
II. Learning Methods
- Classification
- Regression
- Clustering
III. Usage & Theory
- Training
- Performance metrics
- Overfitting, estimator bias & variance
- Curse of dimensionality
Prerequisites
Programming skills necessary. We will be using Python.
Vector geometry & calculus
Some exposure to Prob & Stat would be nice
Some Linear Algebra would be really nice
I will cover/review the bare essentials of Probability, Statistics, & Linear Algebra needed. You are responsible for figuring out the programming on your own.
Books
There is no required text. Most of the old favorites use Matlab. There is a vast supply of free resources online.
- “Learning From Data”, Abu-Mostafa
- “Deep Learning, Vol. 1: From Basics to Practice”, Glassner
- An Introduction to Statistical Learning. James, Witten, Hastie and Tibshirani
- The Elements of Statistical Learning, 2e. Hastie, Tibshirani and Friedman
Outline
Basic Machine Learning introduction
Perceptron example
Python tools (depending on time)
import numpy as np
from matplotlib import pyplot as plt
%matplotlib inline
"Essence of Machine Learning" - Abu-Mostafa
- A pattern exists
- Cannot pin it down mathematically
- We have data for it
- Alternatives: expertise, domain knowledge, science
Example: Movie Rating Prediction
Compare user profiles to movie profiles
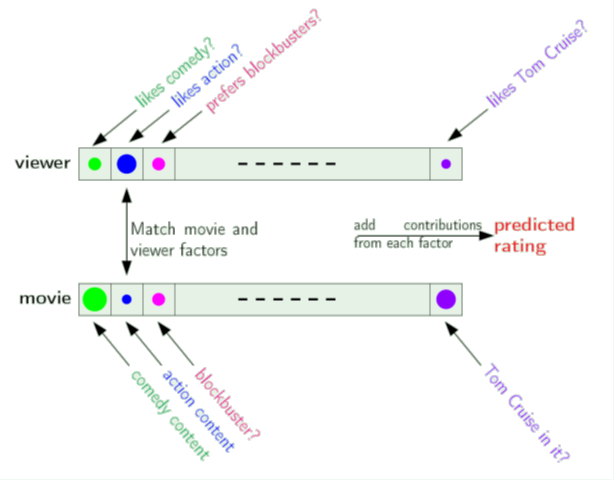
-Yaser Abu-Mostafa, Learning From Data
Movie Rating Prediction - the Learning Approach
Compare user profiles to movie profiles
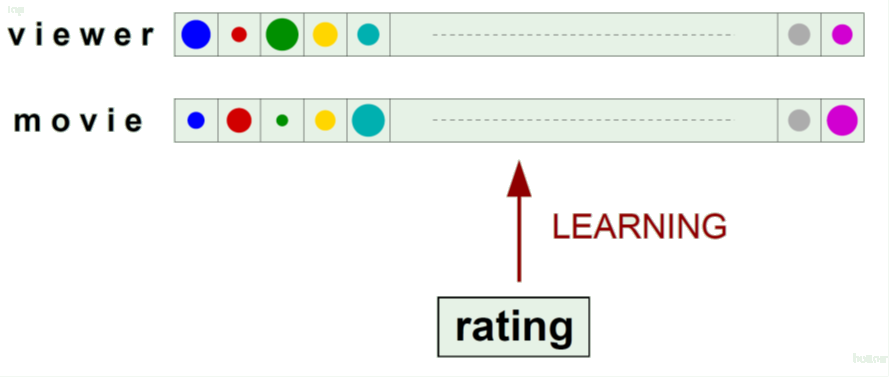
-Yaser Abu-Mostafa, Learning From Data
Example: Credit Scoring
Determine which applicants will be good credit customers.
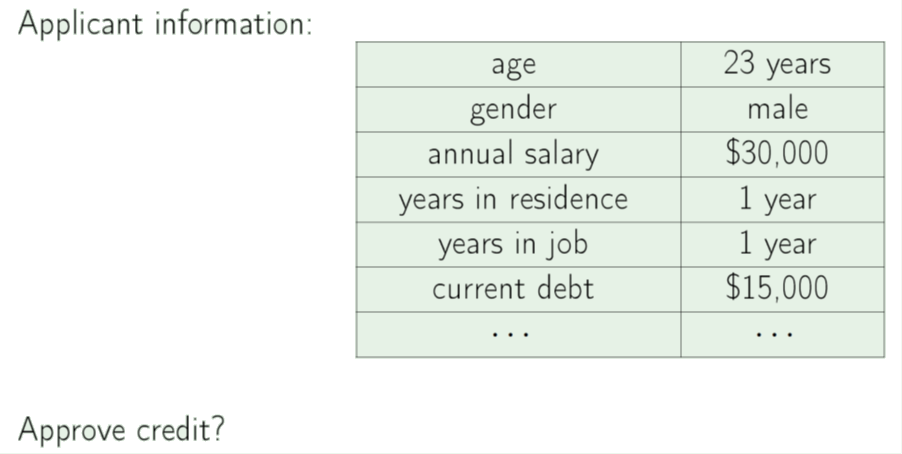
-Yaser Abu-Mostafa, Learning From Data
Formal Method
Input vector $\mathbf x$ $\leftarrow$ information we want function to use
Output scalar $y$ $\leftarrow$ desired output of our learning machine
Data $(\mathbf x_1, y_1), (\mathbf x_2, y_2), ..., (\mathbf x_N, y_N)$
Function $f(\mathbf x) \approx y$
Example Application: Credit Scoring
Determine which applicants will be good credit customers.
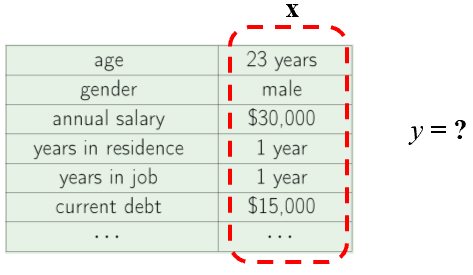
- Function $f(\mathbf x) \approx y$
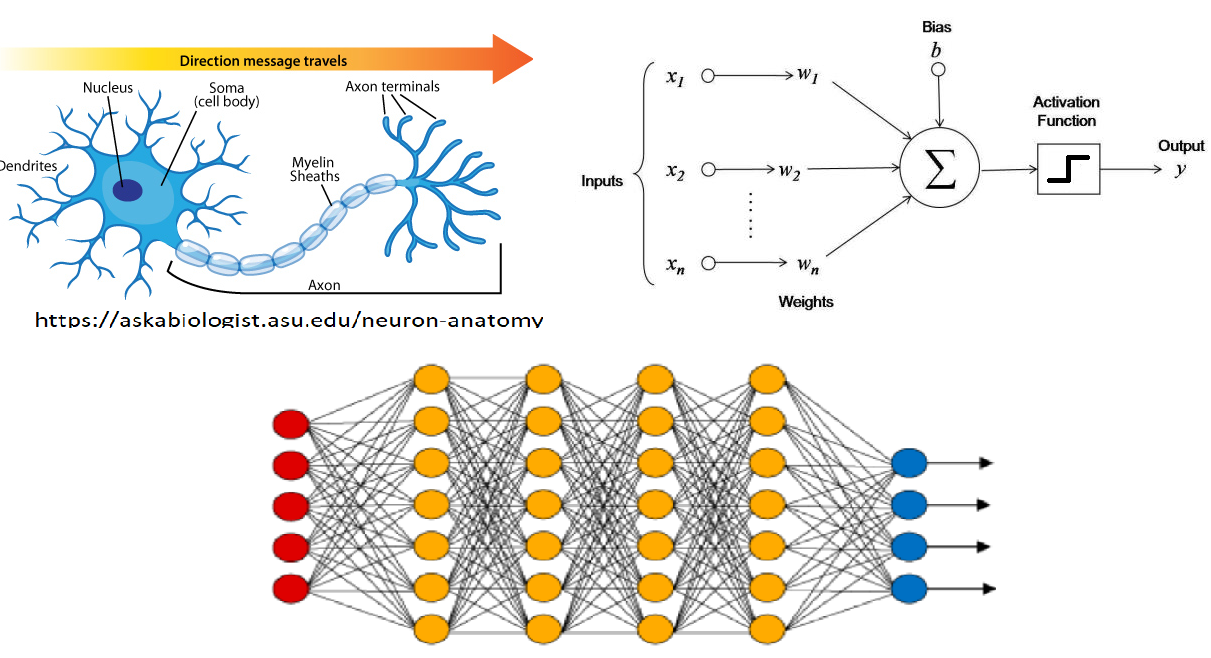
Example Method: Perceptron, an artificial neuron
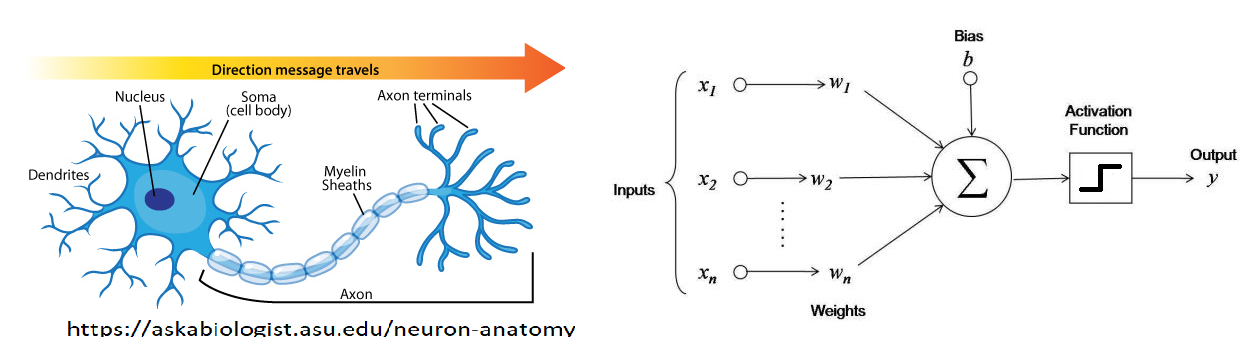
\begin{align} f(\mathbf x) = f(x_1, x_2, ..., x_n) &= \begin{cases} +1, \text{ if } \sum_{i=1}^{n}w_i x_i + b > 0 \\ -1, \text{ if } \sum_{i=1}^{n}w_i x_i + b < 0 \end{cases} \\ &= \text{sign}\left\{ \sum_{i=1}^{n}w_i x_i + b \right\} = \text{sign}(\mathbf w^T \mathbf x) \end{align}
Perceptron Applied to Credit Scoring
2D Example
\begin{align} f(\mathbf x) = \text{sign}\left\{ \sum_{i=1}^{n}w_i x_i + b \right\} = \text{sign}(w_1 x_1 + w_2 x_2 + ... + b) = \text{sign}(w_1 x_1 + w_2 x_2 + b) \approx y \end{align}
X = np.array([
    [8000, 4000],
    [4000, 2000],
    [5000, 6000],
    [3000, 5000],
    [   0, 2000]
])

y = np.array([+1,+1,-1,-1,-1])
for i in np.arange(0,len(X)):
    x_i = X[i]
    y_i = y[i]
    #print(i,x_i,y_i)
    if y_i==-1: # negative samples
        plt.scatter(x_i[0], x_i[1], s=120, marker='_', linewidths=2,color='r')
    if y_i==1: # positive samples
        plt.scatter(x_i[0], x_i[1], s=120, marker='+', linewidths=2,color='b')
plt.plot([1000,10000],[1000,6000]) # example hyperplane
plt.xlabel('income');
plt.ylabel('debt');

Little python understanding check
- arrays
- loops
- if statements
- scatter plot
Learning
That dividing line is determined by our parameters, $w_1$, $w_2$, and $b$.
Can you find parameters that work?
Learning: determining parameters automatically using data
Discuss
Suppose you had a certain input profile $(x_1, x_2, ...)$ you wanted to get a high ($y = +1$) output for, guaranteed. Ignore all else. How might you set the weights to accomplish it?
\begin{align} f(\mathbf x) = \text{sign}\left\{ \sum_{i=1}^{n}w_i x_i + b \right\} = \text{sign}(w_1 x_1 + w_2 x_2 + ... + b) = \text{sign}(w_1 x_1 + w_2 x_2 + b) \approx y \end{align}
Perceptron Learning Algorithm
choose starting $\mathbf w$, $b$, stepsize $\eta$.
For each $(\mathbf x_i, y_i)$: test $f(\mathbf w,b, \mathbf x_i) = y_i$?
- If $f(\mathbf w,b, \mathbf x_i) \neq y_i$, set $(\mathbf w,b) = (\mathbf w,b) + \eta \, y_i \times (\mathbf x_i,1)$
N = 100
X = np.random.rand(N,2)*100000

w_true = np.array([2,-1])
b_true = -30000
f_true = lambda x :np.sign(w_true[0]*x[0]+w_true[1]*x[1] + b_true);

y = np.zeros([N,1])
for i in np.arange(0,len(X)):
    x_i = X[i]
    y_i = f_true(x_i)
    y[i] = y_i
    #print(i,x_i,y_i)
    if y_i==-1: # negative samples
        plt.scatter(x_i[0], x_i[1], s=120, marker='_', linewidths=2,color='r')
    if y_i==1: # positive samples
        plt.scatter(x_i[0], x_i[1], s=120, marker='+', linewidths=2,color='b')
plt.xlabel('income');
plt.ylabel('debt');
plt.plot([(-b_true-100000*w_true[1])/w_true[0],-b_true/w_true[0]],[100000,0]); # example hyperplane

w = np.zeros(2)
b = np.zeros(1)
f = lambda w,b,x :np.sign(w[0]*x[0]+w[1]*x[1] + b);

acc = np.zeros([N,1])

print(w)
eta = 1e-5;
for i in np.arange(0,len(X)):
    x_i = X[i]
    y_i = y[i]
    print(x_i, y_i, f(w,b,x_i), w,b)
    for j in np.arange(0,len(X)):
      acc[i] = acc[i] + y[j]*f(w,b,X[j])/len(X);
    if(y_i != f(w,b,x_i)): # If not classified correctly, adjust the line to account for that point.
       b = b + 1e5*eta*y_i;
       w[0] = w[0] + eta*y_i*x_i[0];
       w[1] = w[1] + eta*y_i*x_i[1];


for i in np.arange(0,len(X)):
    x_i = X[i]
    y_i = f_true(x_i)
    if y_i==-1: # negative samples
        plt.scatter(x_i[0], x_i[1], s=120, marker='_', linewidths=2,color='r')
    if y_i==1: # positive samples
        plt.scatter(x_i[0], x_i[1], s=120, marker='+', linewidths=2,color='b')
plt.xlabel('income');
plt.ylabel('debt');

plt.plot([(-b_true-100000*w_true[1])/w_true[0],-b_true/w_true[0]],[100000,0]); # true hyperplane

plt.plot([(-b-100000*w[1])/w[0],-b/w[0]],[100000,0]); # estimated hyperplane

plt.figure();
plt.plot(acc); # estimated accuracy
plt.xlabel('iteration');
plt.ylabel('accuracy');


...So that's everything in a nutshell (almost)
Models plus optimization algorithms to fit them to data--just like a brain structure that learns from experiences.
Simple example that can extend all the way to cutting-edge Deep Learning techniques.
Two Main Steps
- Learning (Supervised) - using data to optimize function $f(\mathbf x_i) \approx y_i$
- Inference - apply $f(\mathbf x')$ to a new sample to estimate the unknown $y'$.
The things Learning optimizes are Parameters.
Hyperparameters: Learning rate (eta), # of parameters, # of iterations, ...
Where again...
Input vector $\mathbf x$ $\leftarrow$ information we want function to use
Output scalar $y$ $\leftarrow$ desired output of our learning machine
Data $(\mathbf x_1, y_1), (\mathbf x_2, y_2), ..., (\mathbf x_N, y_N)$
Function $f(\mathbf x) \approx y$
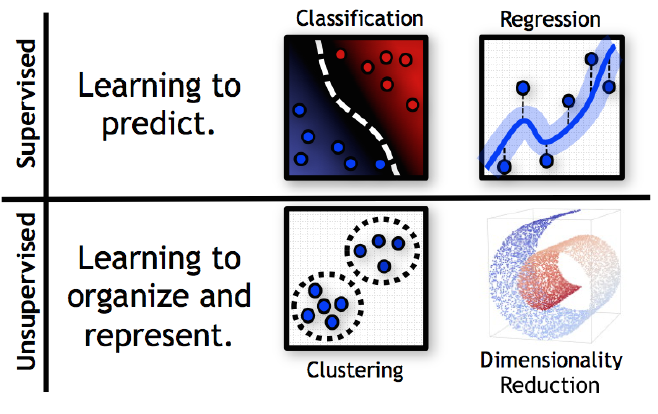
Machine Learning:
- Classification - determining what something is, given features
- Prediction - determining future value, cost, sea level, from past data
- Clustering - finding subgroups
- Dimensionality Reduction - find the meaningful variations in the data
Machine Learning Origins... a lot
Linear Algebra
Statistics
Inverse Problem Theory
Optimization
Pattern Recognition
Artificial Intelligence
Statistical Learning Theory
This Class
- Does not presume Linear Algebra & Statists knowledge/ability. But will need to learn.
- Will cover major methods and key issues at a practical level (e.g., how to invert matrices it in python).
This Class, U of New Haven Style
Professional focus (as opposed to research)
Experiential (as opposed to passive note-taking)
Objectives:
- Be able to apply machine learning methods to data
- Be able to discuss alternative methods critically (job, job interview, etc.)
Approach
- Discussion of methods - homeworks, tests
- Weekly homework - your own work please. Same questions will be on tests.
- In-class (and beyond) labs
- Final project.
Labs will start off solving toy problems on simple datasets. As we proceed we will be using more realistic datasets based on class interests.