Outline
Sampling
Mean & Variance
Correlations
import numpy as np
from matplotlib import pyplot as plt
%matplotlib inline
JARGON ALERT!
Sample can have different meanings in different fields
- Machine Learning
- Statistics
- Signal Processing
What do statisticians call the Machine Learning version of a "sample"?
What are we calling the statisticians' "sample"?
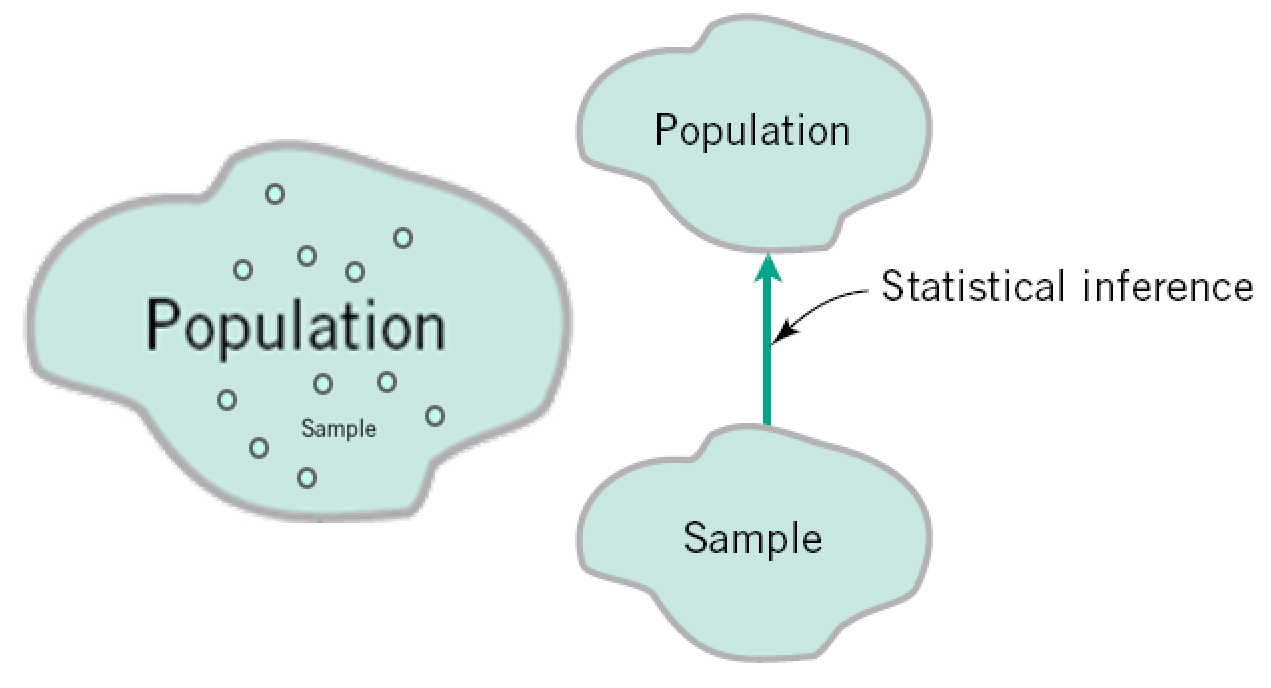
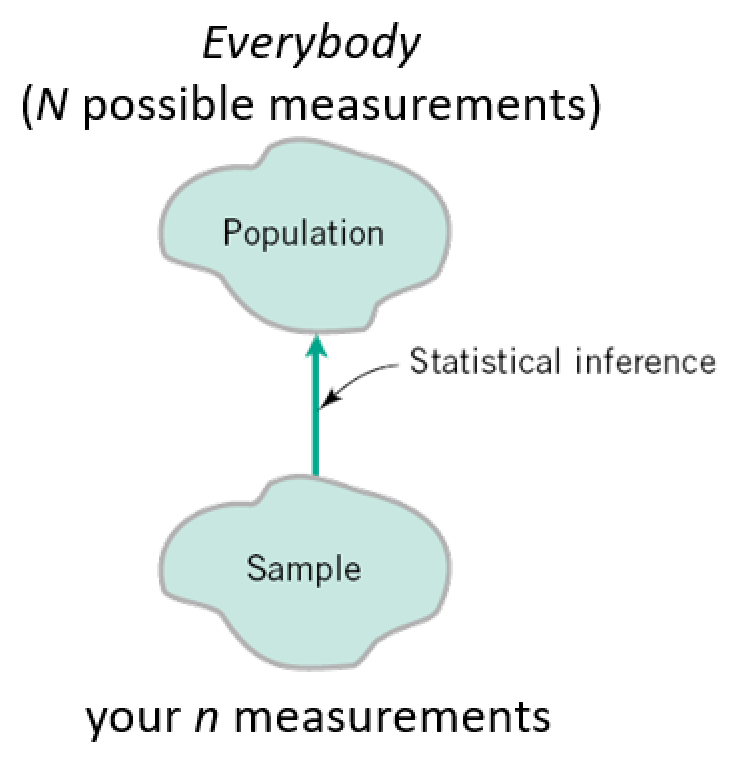
Statistics: Describing data and Populations
Not just the data we have, but presuming our numbers apply to a population we sampled from:
Example: we want to know the average age of college students in the US, so we ask the members of this class and take the average.
What's the sample here?
Abstraction of Populations
Consider what is the population in the examples where we estimate a mean:
- an election where we poll 100 people (what is the mean for this?)
- an industrial process where we measure every 1000th part made
- an experiment where we measure the temperature 10 times
Good versus Bad Sampling
Is polling this class a good way to estimate the average age of US college students? Why or why not?
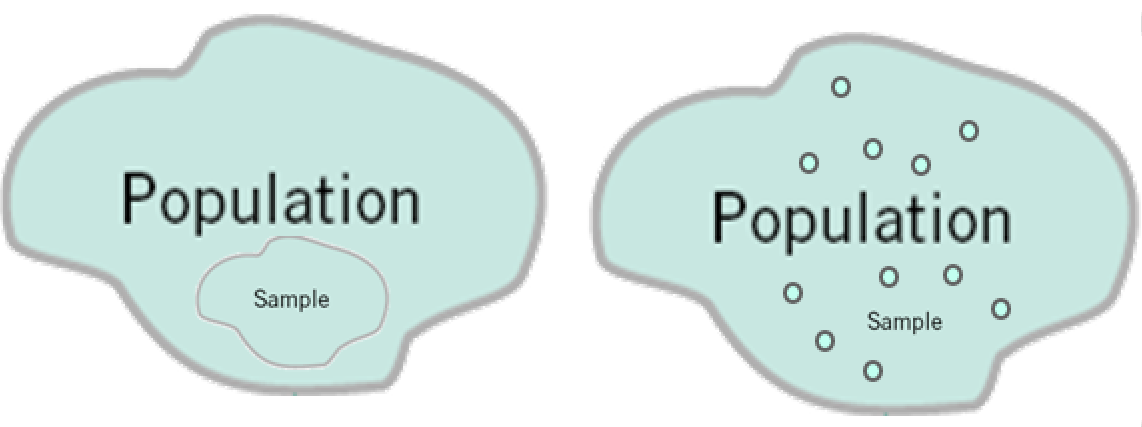
Random Sampling
A central concept in Statistics. If a sample is randomly taken where every member is equally likely to be chosen, then a concept called the Central Limit Theorem (CLT) (generally known by the related Law of Large Numbers), allows us to compute confidence intervals, "$p$-values, etc., describing how good our estimate is.
Ex: If you sample 100 students randomly, your estimate of the average, e.g., 30.5 years, will have a confidence interval of $\pm 3.5$ years. Meaning the estimate is 63% likely to be within the interval [30.5-3.5, 30.5+3.5].
HOWEVER: it all goes out the window if we do a bad job of sampling.
"Real-World Sampling"
- Psychology studies that use psychology students.
- Several hours spent recording info on cars that drive on street through campus.
- Internet searches, youtube searches.
- Study that uses patients who come into their clinic.
- Online polls.
Sampling Bias - error in estimate due to sampling that is not sufficiently random. What kinds of biases might appear in the above list?
Most basic things to do in statistics:
- Data display - _plots, histograms, ..._
- Compute averages $\rightarrow$ _the mean_
- Quantify variability $\rightarrow$ _variance_, _standard deviation_
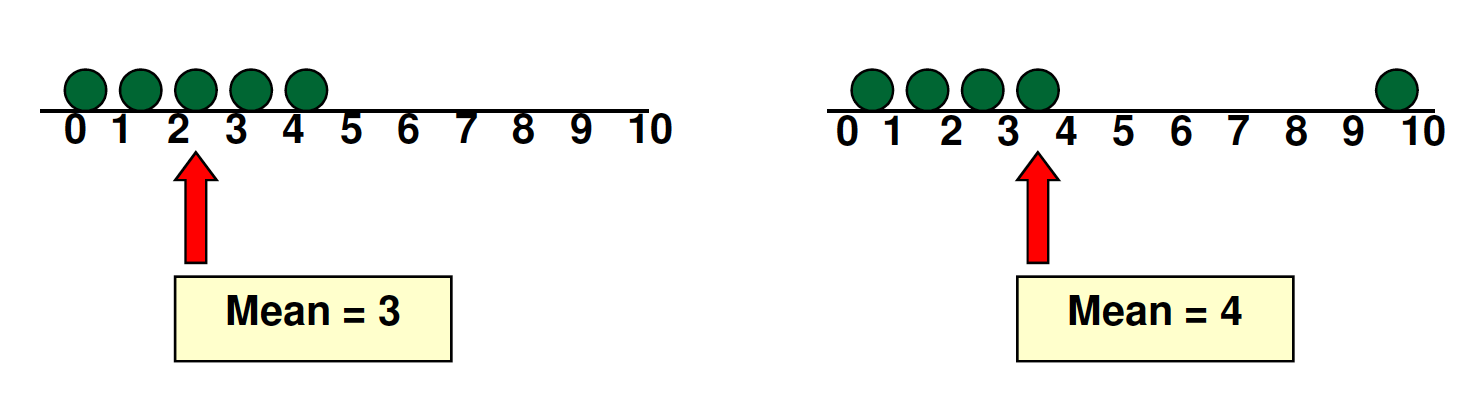
Sample Mean (a.k.a. "Mean")
The arithmetic average of the data values
$$ \bar{x} = \frac{\sum_{i=1}^n x_i}{n} = \frac{x_1 + x_2 + \ldots + x_n}{n} $$ where n is the sample size.
- The most common measure of center
- Can be affected by extreme data values (outliers)
print( (1+2+3+4+5)/5, np.mean((1,2,3,4,5)), (1+2+3+4+10)/5, np.mean((1,2,3,4,10)) )
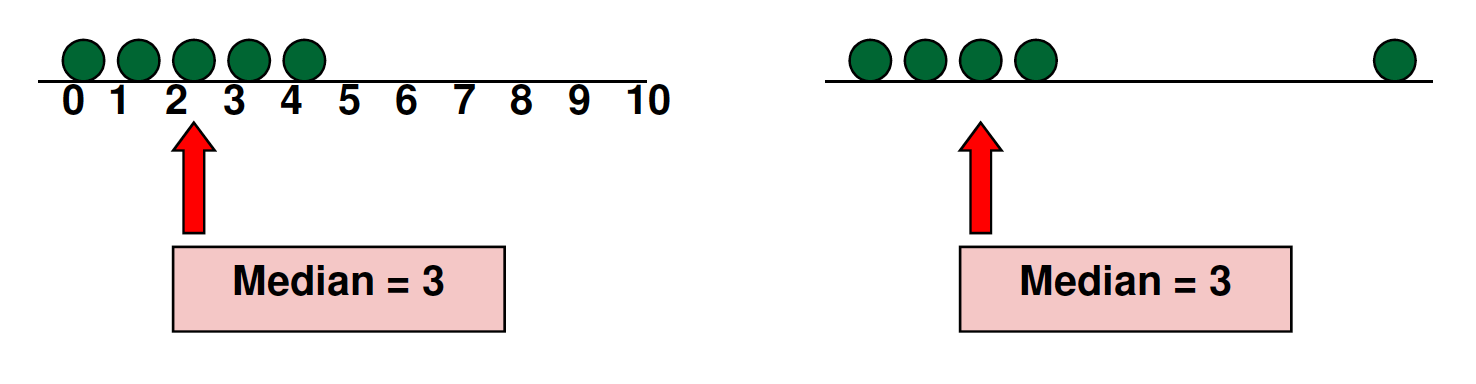
Median
The "middle" number (when the data values are put in order)
- If n is odd, the median is exactly the middle number
- If n is even, the median is the average of the two middle numbers
- Not affected by extreme values (outliers)
Ex: mean salary of 1984 UNC geography grads: \$1M+. Mean \$30k.
print(np.median((1,2,3,4,5)), np.median((1,2,3,4,10)) )
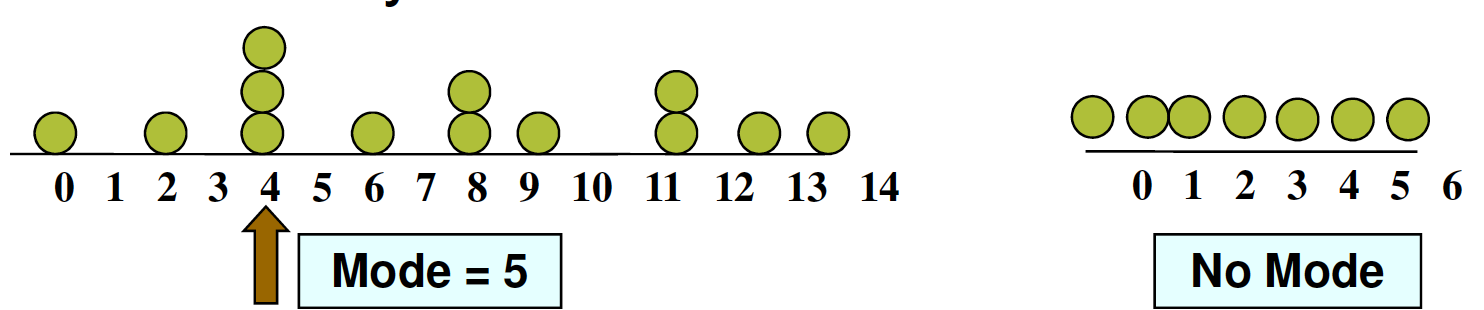
Mode
The most frequently occurred value
- There may be no mode or several modes. "Multimodal" implies multiple peaks in histogram.
- Not affected by extreme values (outliers)
# find it in numpy/scipy
Percentile
The $p^{th}$ percentile - $p\%$ of the values in the data are less than or equal to this value ($0 \leq p \leq 100$)
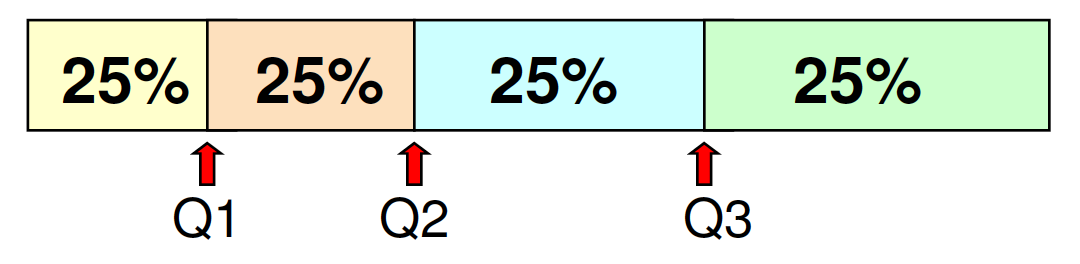
Quartile:
* $1^{st}$ quartile = $25^{th}$ percentile
* $2^{nd}$ quartile = $50^{th}$ percentile = median
* $3^{rd}$ quartile = $75^{th}$ percentile
How might you compute this?
Variance... trickier
Population variance: $\sigma^2 = \frac{\sum_{i=1}^N (x_i - \mu)^2}{N}$
...As in the whole population
Sample variance: $ s^2 = \frac{\sum_{i=1}^n (x_i - \bar{x})^2}{n - 1}$
...As in just the sample
Note that sneaky $n-1$ denominator.
Standard deviation = $\sqrt{\text{Variance}}$
Variance is a kind of avreage too.
# find it in numpy/scipy - multiple ways
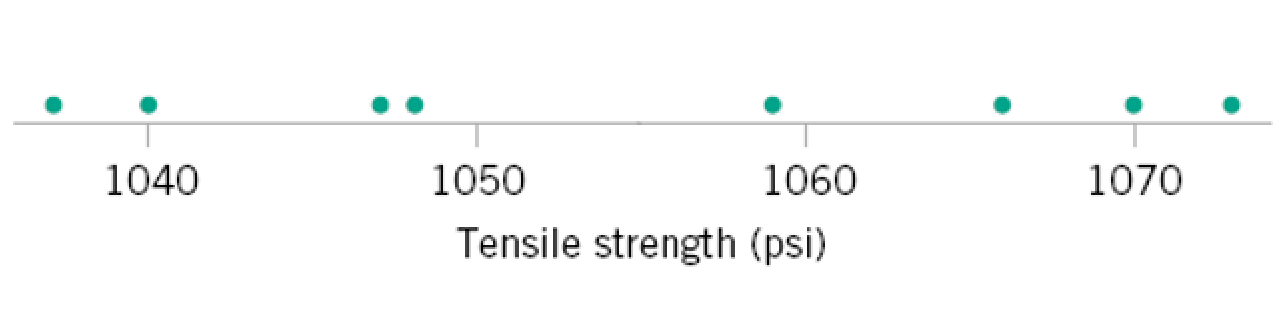
What is the mean? 
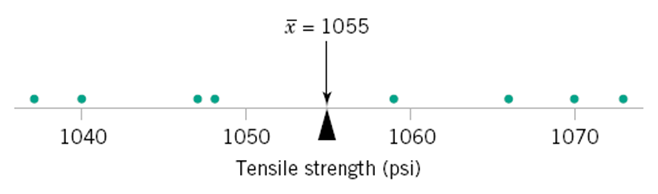
(1048 + 1059 + 1047 + 1066 + 1040 + 1070 + 1037 + 1073)/8
x = np.array([1048, 1059, 1047, 1066, 1040, 1070, 1037, 1073]);
np.mean(x)
What is the Variance & Standard Deviation?
- ## Sample variance: $ s^2 = \frac{\sum_{i=1}^n (x_i - \bar{x})^2}{n - 1}$
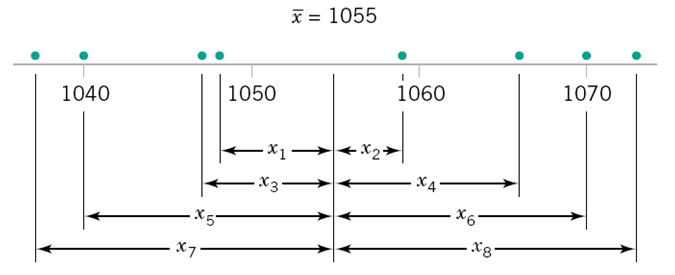
- what are the units of variance and standard deviation?
x = np.matrix([1048, 1059, 1047, 1066, 1040, 1070, 1037, 1073]);
x_bar = x - np.mean(x)
x_bar_2 = np.power(x_bar,2.)

table2_1 = np.concatenate((x.T, x_bar.T, x_bar_2.T), axis=1)

print(table2_1)
np.mean(table2_1,axis=0)
print(np.var(x), np.std(x))
Recap
\begin{align} \text{Population mean} &= \mu = \frac{\sum_{i=1}^N x_i}{N} \\ \text{Sample mean} &= \bar{x} = \frac{\sum_{i=1}^n x_i}{n} \\ \text{Population variance} &= \sigma^2 = \frac{\sum_{i=1}^N (x_i - \mu)^2}{N} \\ \text{Sample variance} &= s^2 = \frac{\sum_{i=1}^n (x_i - \bar{x})^2}{n - 1} = \frac{\sum_{i=1}^n x_i^2 - \frac{1}{n}(\sum_{i=1}^n x_i)^2}{n - 1} \\ \text{Standard deviation} &= \sqrt{\text{Variance}} \end{align}
Multivariate Data - describing relationships
"Multivariate" dataset ~ a matrix with samples for rows and features for columns. Each column (a.k.a. feature) is also known as a variable.
Just focusing on two variables for the moment, say column1 = $x$, and column2 = $y$.
Correlation(s)
\begin{align} \text{Variance} &= s^2 = \frac{\sum_{i=1}^n (x_i - \bar{x})^2}{n - 1} = \frac{\sum_{i=1}^n x_i^2 - \frac{1}{n}(\sum_{i=1}^n x_i)^2}{n - 1} \\ \text{Standard deviation} &= \sqrt{\text{Variance}} \end{align}
\begin{align} \text{Correlation Coefficient} &= r = \frac{ \sum_{i=1}^n (x_i - \bar{x})(y_i - \bar{y})}{\sqrt{\sum_{i=1}^n(x_i - \bar{x})^2}\sqrt{\sum_{i=1}^n(x_i - \bar{x})^2}} = \frac{S_{xy}}{\sqrt{S_{xx} S_{yy}}} \\ %\text{''Corrected Correlation''} % &= S_{xy} = \sum_{i=1}^n (x_i - \bar{x})(y_i - \bar{y}) % = \sum_{i=1}^n x_i y_i - \frac{1}{n}(\sum_{i=1}^n x_i)(\sum_{i=1}^n y_i) \\ \text{Covariance} &= S_{xy} = \frac{1}{n-1}\sum_{i=1}^n (x_i - \bar{x})(y_i - \bar{y}) % = \sum_{i=1}^n x_i y_i - \frac{1}{n}(\sum_{i=1}^n x_i)(\sum_{i=1}^n y_i) \end{align}
Look kind of familiar? Relate to variance.
Questions
What are $S_{xx}$ and $S_{yy}$ also called?
Can you relate the covariance to a distance metric?
Exercises
\begin{align} \text{Correlation Coefficient} &= r = \frac{ \sum_{i=1}^n (x_i - \bar{x})(y_i - \bar{y})}{\sqrt{\sum_{i=1}^n(x_i - \bar{x})^2}\sqrt{\sum_{i=1}^n(x_i - \bar{x})^2}} = \frac{S_{xy}}{\sqrt{S_{xx} S_{yy}}} \end{align}
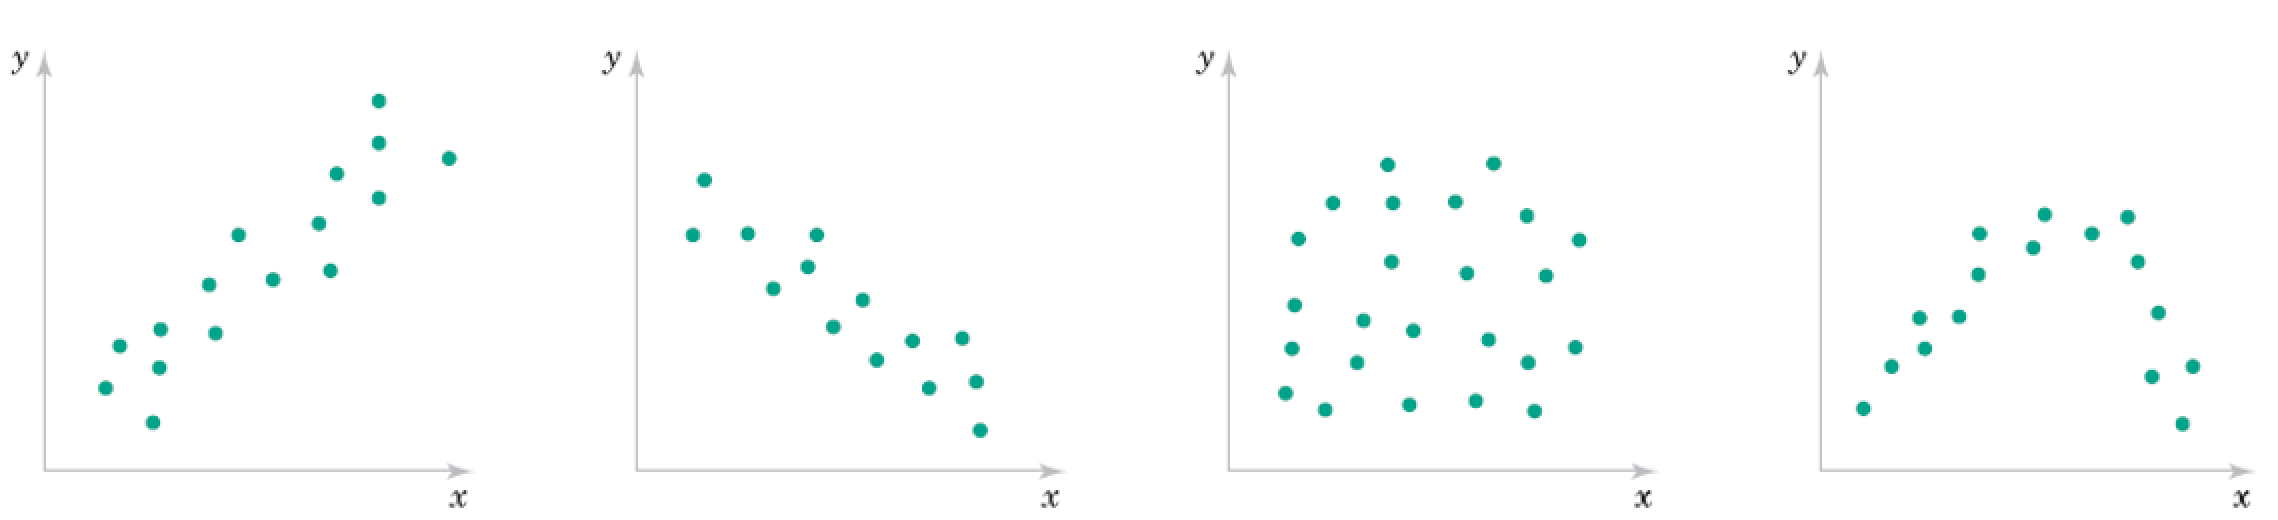
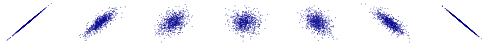
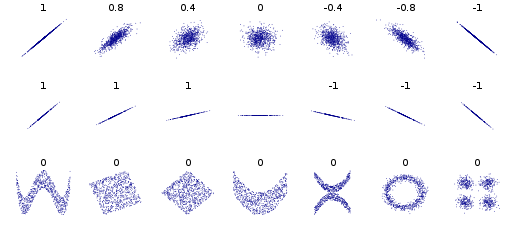
Roughly what are the correlation coefficients here?

Correlation Qualitative Behavior
- What does magnitude tell you about the relationship?
- What does sign tell you about the relationship?
- Would you expect the Covariance to be similar?
Lab
Generate N Gaussian random numbers and compute mean and std and plot histograms, for N=10,100,1000.
Load IRIS dataset and compute pairwise correlations between features.
Now standardize each feature and give scatter plot for pairs of columns with highest pairwise correlation. Also give scatter plot for the pair of columns with lowest pairwise correlation.