Hacking Math I
Spring 2020

Topic 3: Numerical programming with Vectors
This topic:
- Vector Computations
- Matrix algebra (via vectors)
- Visualization
Reading:
- I2ALA Chapter 1
- CTM Chapter 2,4
I. Vector Computations
Vector - Multiple numbers "drawn from a field"
A $k$-dimensional vector $y$ is an ordered collection of $k$ numbers $y_1 , y_2 , . . . , y_k$ written as $\textbf{y} = (y_1,y_2,...,y_k)$.
The numbers $y_j$, for $j = 1,2,...,k$, are called the $\textbf{components}$ of the vector $y$.
Note boldface for vectors and italic for scalars.
It can be written either as rows or columns, and we won't worry about this.
$$\textbf{y} = \begin{bmatrix} y_1 \\y_2 \\ \vdots \\ y_k \end{bmatrix} = [y_1,y_2,...,y_k]^{T} $$(Swapping rows and columns = transposing. 1st column = top. 1st row = left.)
Drawn from a Field?
Recall a field is a set. So a vector has each member from the set.
Vector of real numbers $\mathbf v \in \mathbf R^n$
Vector of binary numbers $\mathbf b \in GF(2)^n$
What is the notation for our previous examples?
Data Structure Options
- Python Sets
- Python Lists
- Python Tuples
- Python Dictionaries
Consider how you would use each of these to make a vector of coordinates.
Recall the other kinds of info we make into vectors. Does the data structure work for all of them?
Famous vectors
- zero vector
- ones vector
- "unit vector" - a.k.a. standard basis
Exercise: create a function for each to return a vector of length $n$
Sparsity
Sparse in linear algebra refers to vectors or matrices filled with mostly zeros.
What is the number of nonzero elements for each of our famous vectors, for length $n$.
- zero vector
- ones vector
- "unit vector" - a.k.a. standard basis
Vector Examples
What are the elements of the vector for each?
Location
Direction
color
stock portfolio
time series
images
word count histogram
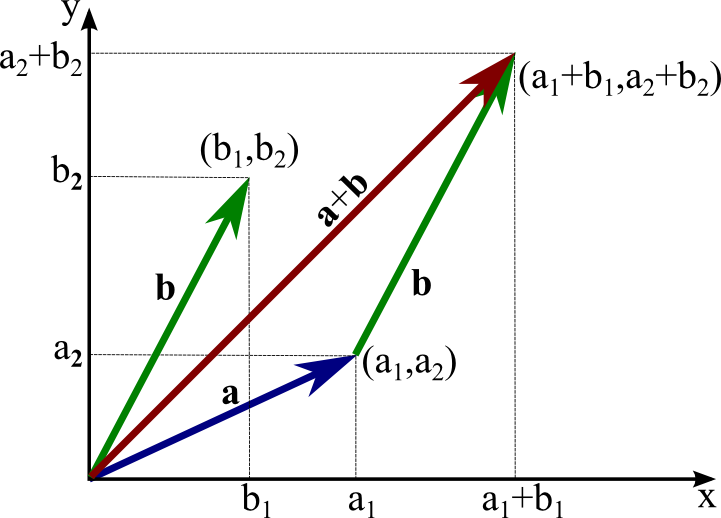
Vector Addition $\mathbf a + \mathbf b$
Addition of two k-dimensional vectors $\textbf{x} = (x_1, x_2, ... , x_k)$ and $\textbf{y} = (y_1,y_2,...,y_k)$ is defined as a new vector $\textbf{z} = (z_1,z_2,...,z_k)$, denoted $\textbf{z} = \textbf{x}+\textbf{y}$,with components given by $z_j = x_j+y_j$.
Applications
Consider what adding these vectors would mean
Location
Direction
color
stock portfolio
time series
images
word count histogram
Geometrical perspective.
It assumes the position application of a vector, very common for geometrical reasoning about linear algebra.
Exercise:
- implement vector addition using lists that represent vectors
- make it work for any number of dimensions
Scalar-Vector multiplication $\alpha \mathbf y$
Scalar multiplication of a vector $\textbf{y} = (y_1, y_2, . . . , y_k)$ and a scalar α is defined to be a new vector $\textbf{z} = (z_1,z_2,...,z_k)$, written $\textbf{z} = \alpha\ \textbf{y}$ or $\textbf{z} = \textbf{y} \alpha$, whose components are given by $z_j = \alpha y_j$.
Exercise:
- implement scalar-vector multiplication using a lists that represent a vector
- make it work for any number of dimensions
Linear Combinations
Given a set of scalars $\beta_1,\beta_2,...$ and vectors $a,b,c,...$
$$\beta_1 a + \beta_2 b + ...$$Special cases
- $a,b,...$ are unit vectors $e_i$
- average
- affine combination
- convex combination, a.k.a. weighted average, a.k.a. mixture
Geometric view
- linear combination of one, two, three vectors
- affine combination of one, two, three vectors
- convex combination of one, two, three vectors
The Dot Product $\mathbf x \cdot \mathbf y$
Also known as inner product
If we have two vectors: ${\bf{x}} = (x_1, x_2, ... , x_k)$ and ${\bf{y}} = (y_1,y_2,...,y_k)$
The dot product is written: ${\bf{x}} \cdot {\bf{y}} = x_{1}y_{1}+x_{2}y_{2}+\cdots+x_{k}y_{k}$
If $\mathbf{x} \cdot \mathbf{y} = 0$ then $x$ and $y$ are orthogonal
Examples
- inner product with unit vector $e_i^T a$
- sum - inner product with what $u^T a$
- average - inner product with what? $v^Ta$
- sum of squares?
Applications
- $a$ and $b$ as binary even occurence vectors - set intersection
- weighted score
- price vector and quantity vector
- expected value
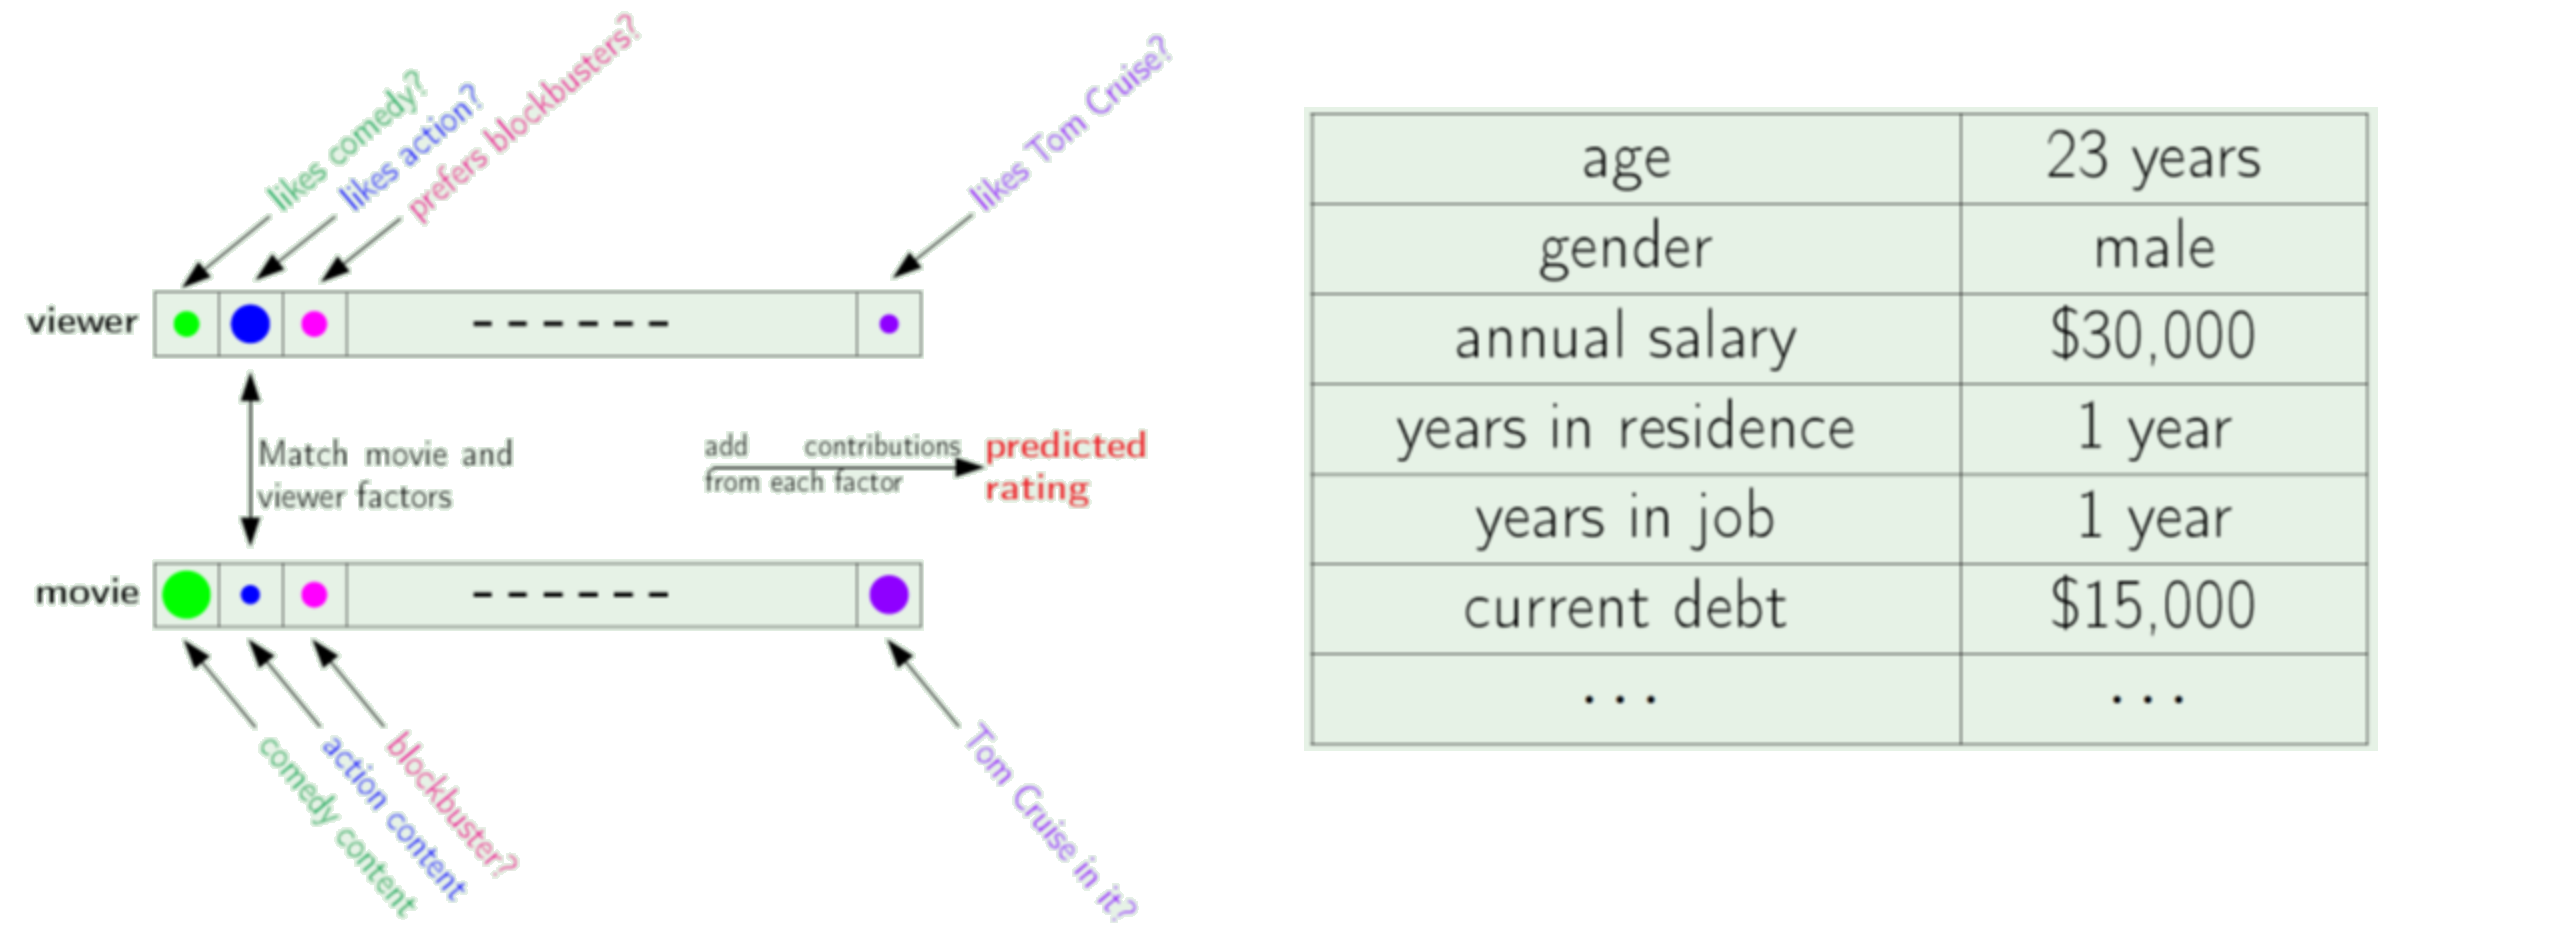
- sentiment estimate via word histogram and word sentiment vector
Applications - Artificial Neuron
You may have heard of this little guy:
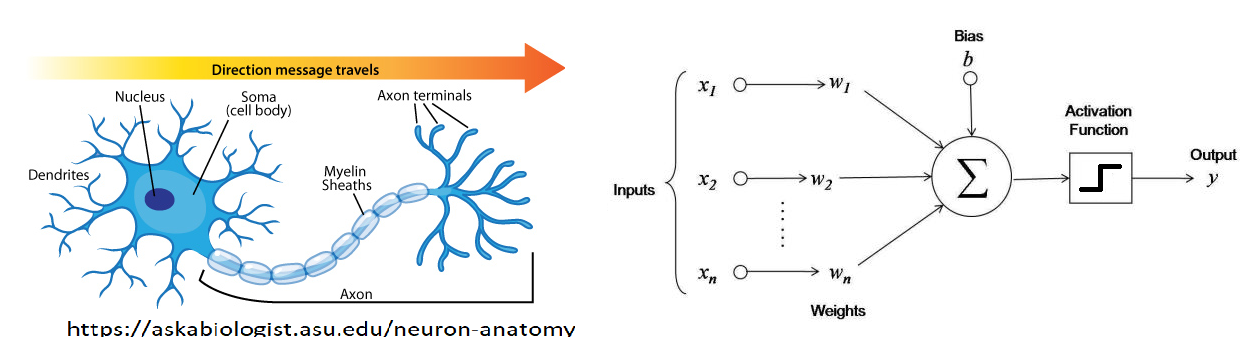
Write the function this implements
Code the dot product in Python
Choose appropriate data structures for your vectors
Make it work for any number of dimensions
Properties of Dot Product
- Commutative
- Homogeneous
- Distributes over vector addition
Test them with your code and example vectors
Homogeneity: $(\alpha \mathbf x) \cdot \mathbf y = \alpha (\mathbf x \cdot \mathbf y)$
Consider what this means for using the dot product to measure similarity.
Use your functions to implement this both ways.
Famous vectors
- zero vector
- ones vector
- "unit vector" - a.k.a. standard basis
What is the dot product with each of them?
Time to get serious...
Suppose your vector was extremely long but very sparse.
How would you make a "compressed" vector representation?
Make functions to scale and add such vectors
Sparse Vectors
Dense vectors are stored in a list or array where position gives index
$$[v_1,v_2,v_3] \text{ stored as } [v_1, v_2, v_3] \text{ in ordered data structure }$$Easy to access $k$the element via startingaddress + k $\rightarrow v{k+1}$ (note zero-based indexing in computers)
Sparse vectors are stored in a compact form to save memory space, only maintain nonzero values This requires we also store the indices of these nonzero values
$$ [0,0,0,0.1,0,0,0,0.5,0,0] \text{ stored as } [(4,0.1),(8,0.5)] $$Additional overhead required for accessing and performing operations.
Python Lab
Make a class for "dense" vectors that contains all your functions thus far.
Add methods for handling sparse vectors:
- Vector addition
- Scalar-vector multiplication
- Dot product
Compare speed to large dense vectors for different levels of density.
Advanced: compare to sparse vectors in numpy.
II. A Brief Foray into Matrices
Matrices
A matrix $\mathbf A$ is a rectangular array of numbers, of size $m \times n$ as follows:
$\mathbf A = \begin{bmatrix} A_{1,1} & A_{1,2} & A_{1,3} & \dots & A_{1,n} \\ A_{2,1} & A_{2,2} & A_{2,3} & \dots & A_{2,n} \\ \vdots & \vdots & \vdots & \ddots & \vdots \\ A_{m,1} & A_{m,2} & A_{m,3} & \dots & A_{m,n} \end{bmatrix}$
Where the numbers $A_{ij}$ are called the elements of the matrix. We describe matrices as wide if $n > m$ and tall if $n < m$. They are square iff $n = m$.
NOTE: naming convention for scalars vs. vectors vs. matrices.
Implementing a Matrix using Python Lists
How might you do this?
Method 1: Just using a single list and put elements in some predetermined order
$$\begin{bmatrix} A_{1,1} & A_{1,2} & A_{1,3} & \dots & A_{1,n} & A_{2,1} & A_{2,2} & A_{2,3} & \dots & A_{2,n} & \ddots & A_{m,1} & A_{m,2} & A_{m,3} & \dots & A_{m,n} \end{bmatrix}$$Your matrix algebra functions will need to access the data properly.
Exercise: if you store a matrix this way, what is code to extract element $A_{i,j}$?
Method 2: Nested lists
There are two different ways to interpret this, what are they?
Easy Functions
Scalar Multiplication
Scalar multiplication of a matrix $\textit{A}$ and a scalar α is defined to be a new matrix $\textit{B}$, written $\textit{B} = \alpha\ \textit{A}$ or $\textit{B} = \textit{A} \alpha$, whose components are given by $b_{ij} = \alpha a_{ij}$.
Matrix Addition
Addition of two $m \times n$ -dimensional matrices $\textit{A}$ and $\textit{B}$ is defined as a new matrix $\textit{C}$, written $\textit{C} = \textit{A} + \textit{B}$, whose components $c_{ij}$ are given by addition of each component of the two matrices, $c_{ij} = a_{ij}+b_{ij}$.
Matrix Equality
Two matrices are equal when they share the same dimensions and all elements are equal. I.e.: $a_{ij}=b_{ij}$ for all $i \in I$ and $j \in J$.
Exercise: implement these with your matrix.
Example 2:
$\textit{B} = \begin{bmatrix} 1 & 2 \\ 0 & -3 \\ 3 & 1 \\ \end{bmatrix}$
$\textit{B}^{T} = ?$
Exercise: transpose your python matrix
Matrix-Vector Multiplication
Two perspectives:
Linear combination of columns
Dot product of vector with rows of matrix
$\begin{bmatrix} 2 & -6 \\ -1 & 4\\ \end{bmatrix} \begin{bmatrix} 2 \\ -1 \\ \end{bmatrix} = ?$
Example 4:
$\begin{bmatrix} 2 & -6 \\ -1 & 4\\ \end{bmatrix} \begin{bmatrix} 1 \\ 0 \\ \end{bmatrix} = ?$
Exercise: implement both ways in python. Why is it useful to have both?
Matrix Multiplication
Multiplication of an $m \times n$ -dimensional matrices $\textit{A}$ and a $n \times k$ matrix $\textit{B}$ is defined as a new matrix $\textit{C}$, written $\textit{C} = \textit{A}\textit{B}$, whose elements $C_{ij}$ are $$ C_{i,j} = \sum_{l=1}^n A_{i,l}B_{l,j} $$
View as row by column multiplication, where the value of each cell in the result is achieved by multiplying each element in a given row $i$ of the left matrix with its corresponding element in the column $j$ of the right matrix and adding the result of each operation together. This sum is the value of the new the new component $c_{ij}$.
Example
$\begin{bmatrix} 2 & 6 & -3 \\ 1 & 4 & 0 \\ \end{bmatrix} \begin{bmatrix} 1 & 2 \\ 0 & -3 \\ 3 & 1 \\ \end{bmatrix} = ?$
$\textit{C} = \textit{A}\textit{B}$ via Matrix-vector multiplication
- Each column of $\textit{C}$ as linear combination of columns of $A$
- Each row of $\textit{C}$ as linear combination of rows of $B$
- Advanced: $\textit{C}$ as sum of outer products of columns of $A$ and rows of $B$
Lab: Matrix-matrix multiplication
There are many ways to programmatically implement matrix multiplication
Let us focus on just the two which are direct extensions of the preview matrix-vector multiplication methods
Use your dense vector functions to perform vector matrix multiplication - both by columns and by rows
Lab: Sparse Matrix Algebra
Consider the extension of sparse vectors to sparse matrices.
Write (completely) new functions to compute sparse matrix-matrix products.
III. Visualization
Matplotlib
Tutorial from: https://github.com/amueller/scipy-2017-sklearn/blob/master/notebooks/02.Scientific_Computing_Tools_in_Python.ipynb
Another important part of machine learning is the visualization of data. The most common
tool for this in Python is matplotlib. It is an extremely flexible package, and
we will go over some basics here.
Jupyter has built-in "magic functions", the "matoplotlib inline" mode, which will draw the plots directly inside the notebook. Should be on by default.
import matplotlib.pyplot as plt
plt.plot(y);

Scatter plot (x versus y)
plt.scatter(x, y);

Display matrix via imshow (image show)
# note that origin is at the top-left by default!

plt.imshow(im);
plt.colorbar();
plt.xlabel('x')
plt.ylabel('y')
plt.show();

Display matrix via imshow (image show)
# note that origin here is at the bottom-left by default!

plt.contour(im);

3D surface plot
from mpl_toolkits.mplot3d import Axes3D
ax = plt.axes(projection='3d')
xgrid, ygrid = np.meshgrid(x, y.ravel())
ax.plot_surface(xgrid, ygrid, im, cmap=plt.cm.viridis, cstride=2, rstride=2, linewidth=0);

There are many more plot types available. See matplotlib gallery.
Test these examples: copy the Source Code
link, and put it in a notebook using the %load magic.
For example:
# %load http://matplotlib.org/mpl_examples/pylab_examples/ellipse_collection.py
Lab: Visualization of vectors & matrices
- Generate a random vector and use matplotlib to plot
- Generate two random vectors and use matplotlib to plot one versus the other
- Generate a random matrix and use matplotlib to display as image
Lab: Maximization/minimization via plotting
Use visualization to determine the critical points of the following function:
*$f(x) = 3x^3-10x+3$ on interval [-2,2]